Network Charts |
|
Network charts are specified slightly differently from other charts. Although network charts are technically 2-dimensional charts, they require 4 attributes of data.
LINGO supports two different formats for specifying network charts -- netarc and netnode. In netarc format, each arc is specified by two (X,Y) pairs, indicating the two end points of the arc. Whereas in netnode format, each node in the network is specified with one (X,Y) pair, and each arc between the nodes is specified by pair of arc indices from the arcs set. An example of both formats follows:
MODEL:
! Illustrates the two formats for network charts:
NETARC and NETNODE;
SETS:
NODES /N1..N4/: NODEX, NODEY;
NODESINNET /1..6/: N1, N2;
ARCS( NODES, NODES) /
N1,N2, N2,N3, N3,N4, N4,N1, N4,N2, N1, N3
/: X1, Y1, X2, Y2;
ENDSETS
DATA:
!List locations of all the nodes;
NODEX, NODEY =
10, 10,
20, 10,
20, 40,
10, 40;
!And list the indices of the nodes
that have arcs between them;
N1, N2 =
1, 2,
2, 3,
3, 4,
4, 1,
4, 2,
1, 3;
ENDDATA
CALC:
!Load the arc coordinates into X1, Y1, X2, Y2;
@FOR( ARCS( I, J):
X1( I, J) = NODEX( I);
Y1( I, J) = NODEY( I);
X2( I, J) = NODEX( J);
Y2( I, J) = NODEY( J);
);
ENDCALC
END
Model: CHARTNET
The CHARTNET model above uses both network chart formats for specifying a rectangular network of four nodes with each node pair being joined by an arc. After solving the model, you can display the network using netarc format by running the Solver|Solution command and filling out the dialog box using the netarc attributes (X1, Y1, X2 and Y2) and clicking on the "Netarc" radio button as follows:

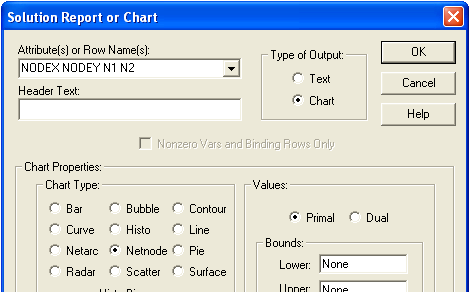
To display the network using netnode format, you would fill out the dialog box as below, using the netnode attributes (NODEX, NODEY, N1 and N2) along with checking off the "Netnode" radio button:

In both cases, you should then generate a network chart resembling:

